California's drought
California's drought has been in the news quite a bit lately, complete with dire predictions for agriculture and food prices across the US. The one question I had after reading several articles is "Just how bad is it?" The answer: Really bad.
I used NOAA data for precipitation for the state of California between January 1895 and January 2014, downloading data for each month and then compiling it into a single time series. I then calculated the monthly average precipitation for each year, weighting each month by the number of days in the month, as well as calculated the average for the entire time period. In the graphs below, the horizontal black line is the average for the entire time period, the red line is the loess smooth line to highlight the trend.
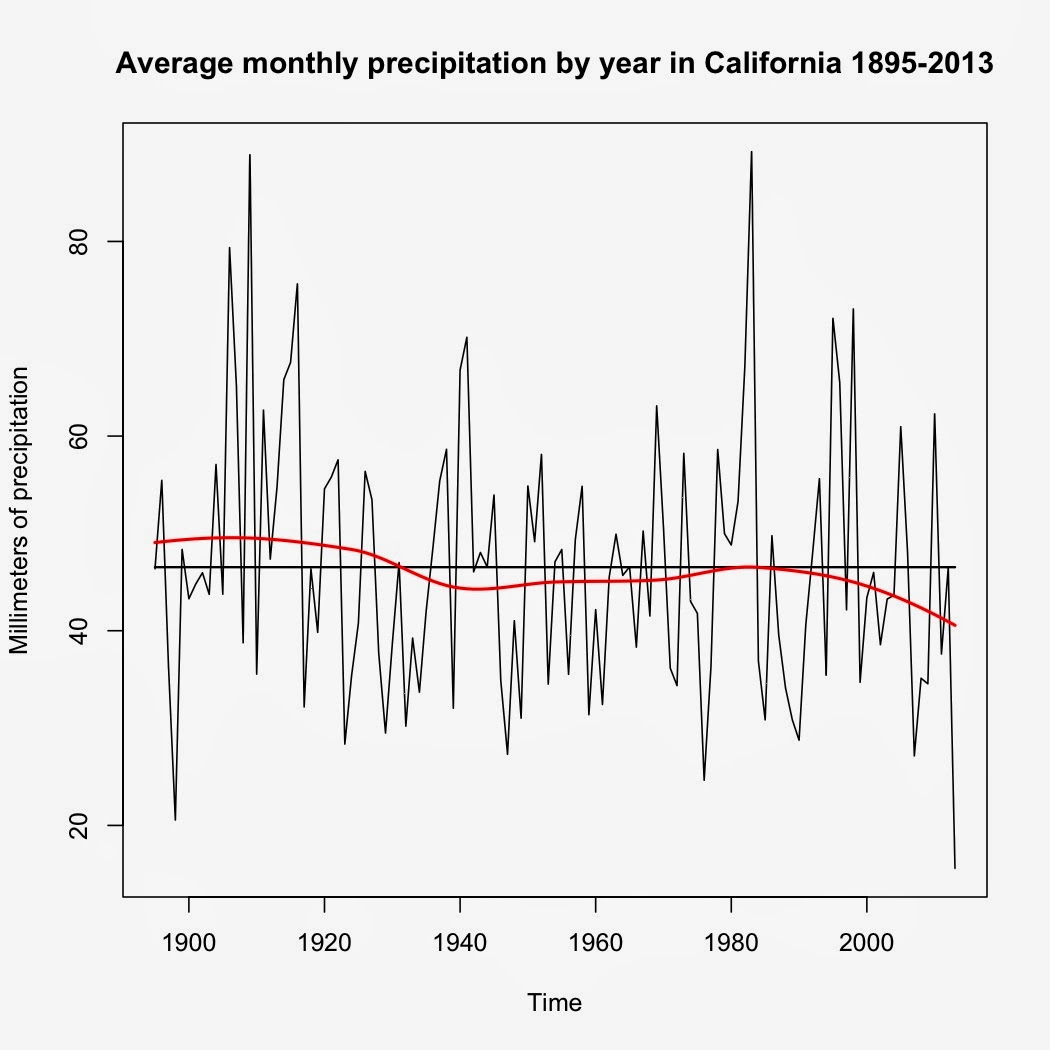
The past year (2013) had the lowest monthly average in the entire time period and it wasn't even close. 2013 beat the number two year, 1898, by nearly 5 millimeters (15.59 mm vs. 20.55 mm). The average across the entire time period was 46.53 mm per month, with 2013 an astounding 31 mm per month below the overall monthly average. The data also reveals that 2013 came after two consecutive years of below-average precipitation amid an overall drying trend since the 1980s.
Shifting over to California temperatures, the monthly average per year has been rising since the 1950s.

What we're left with, then, is a state that has become hotter and drier. And that bodes ill for both agriculture and for all the water sharing arrangements that were worked out during cooler, wetter conditions.
Update:
Climate Progress has a nice write-up with links to further information and why this drought is a preview of what's coming for California.
I used NOAA data for precipitation for the state of California between January 1895 and January 2014, downloading data for each month and then compiling it into a single time series. I then calculated the monthly average precipitation for each year, weighting each month by the number of days in the month, as well as calculated the average for the entire time period. In the graphs below, the horizontal black line is the average for the entire time period, the red line is the loess smooth line to highlight the trend.
The past year (2013) had the lowest monthly average in the entire time period and it wasn't even close. 2013 beat the number two year, 1898, by nearly 5 millimeters (15.59 mm vs. 20.55 mm). The average across the entire time period was 46.53 mm per month, with 2013 an astounding 31 mm per month below the overall monthly average. The data also reveals that 2013 came after two consecutive years of below-average precipitation amid an overall drying trend since the 1980s.
Shifting over to California temperatures, the monthly average per year has been rising since the 1950s.
What we're left with, then, is a state that has become hotter and drier. And that bodes ill for both agriculture and for all the water sharing arrangements that were worked out during cooler, wetter conditions.
Update:
Climate Progress has a nice write-up with links to further information and why this drought is a preview of what's coming for California.


Comments
Post a Comment